Quick answer
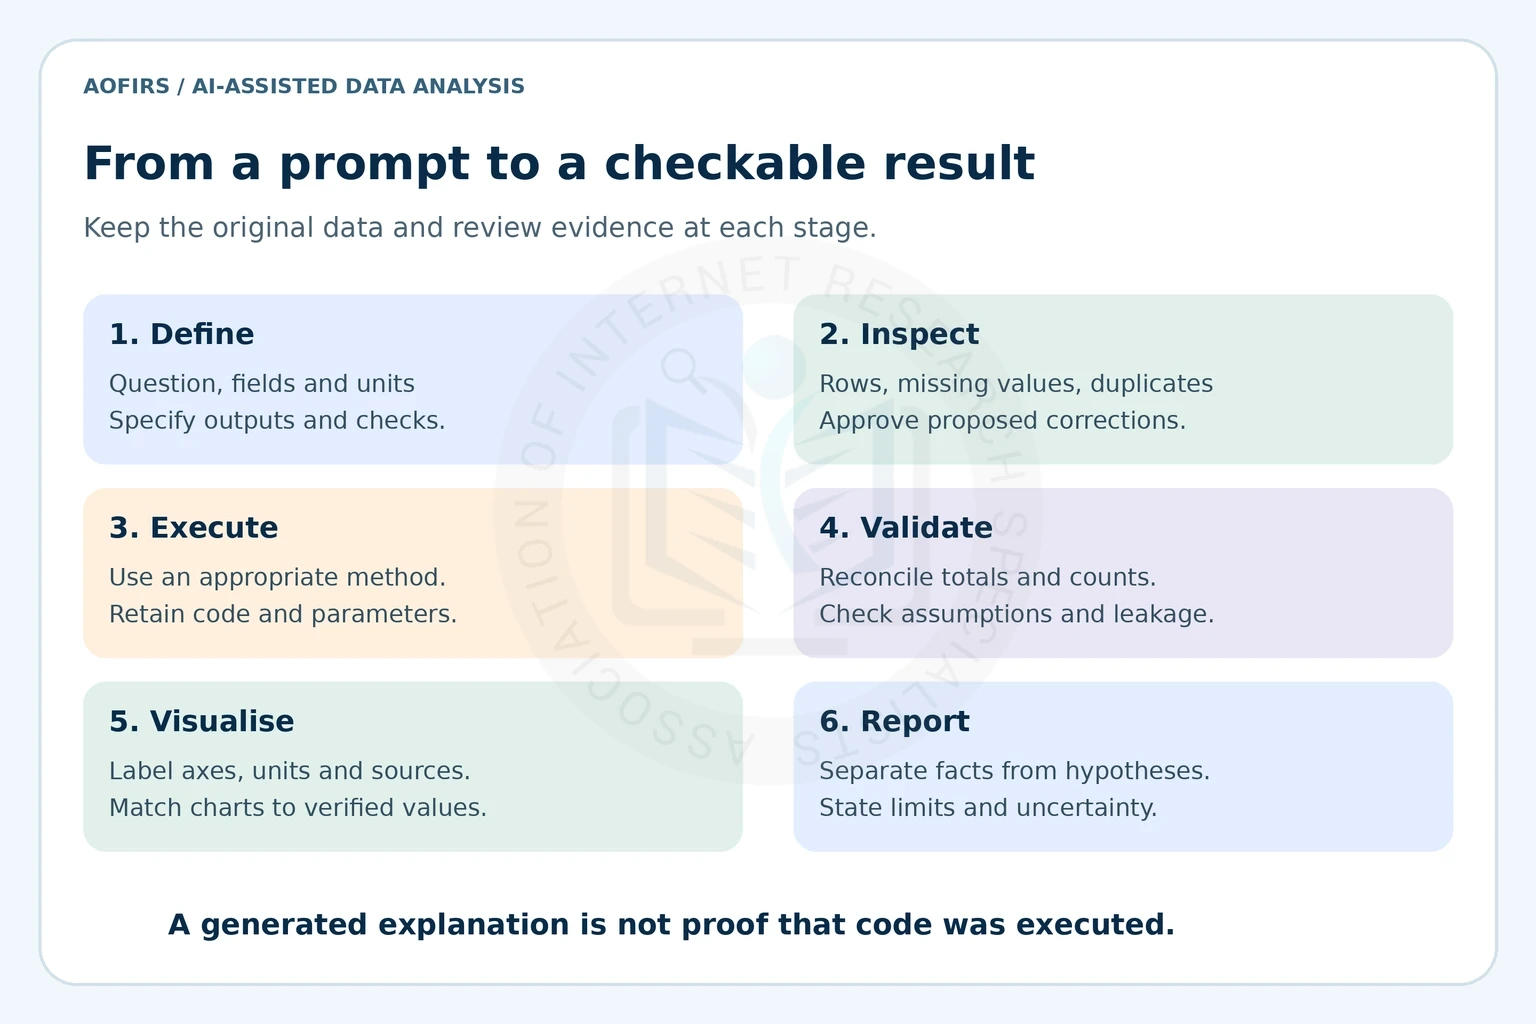
Use structured prompts for cleaning, scaling, summaries, charts, trends, regression, category comparisons, clustering, correlation, sentiment, forecasting, and reporting. Ask for executable code or formulas, visible assumptions, and checks. A generated explanation does not demonstrate that the calculation was executed.
Reviewed 19 October 2026. These are adaptable templates, not measured guarantees of model performance. Replace bracketed fields before use. If a system cannot read the file or execute calculations, request reproducible Python, R, SQL, or spreadsheet instructions instead of accepting invented results.
Before you start: define and protect the data
Preserve the original file. Define what each row represents, identify key fields, document units and date formats, and create a short data dictionary. Check missing values, duplicates, and inconsistent categories before analysis. Specify the question, relevant columns, output format, and review criteria.
For broader instruction design, see AOFIRS’s guide to prompt engineering for researchers. Its report on data analysis for researchers provides related methodological context.
Use an approved processing environment for confidential data. Check organizational policies, provider terms, retention, and access controls. Remove unnecessary identifiers; removing names alone does not guarantee anonymity.
12 AI prompt templates for data analysis
Use one task at a time. Review its output before passing results into the next stage. Keep the dataset version, prompt, code, settings, and corrections together.
1. Data cleaning: audit missing values and duplicates
Use for customer records, surveys, and exported spreadsheets.
Copy-ready prompt
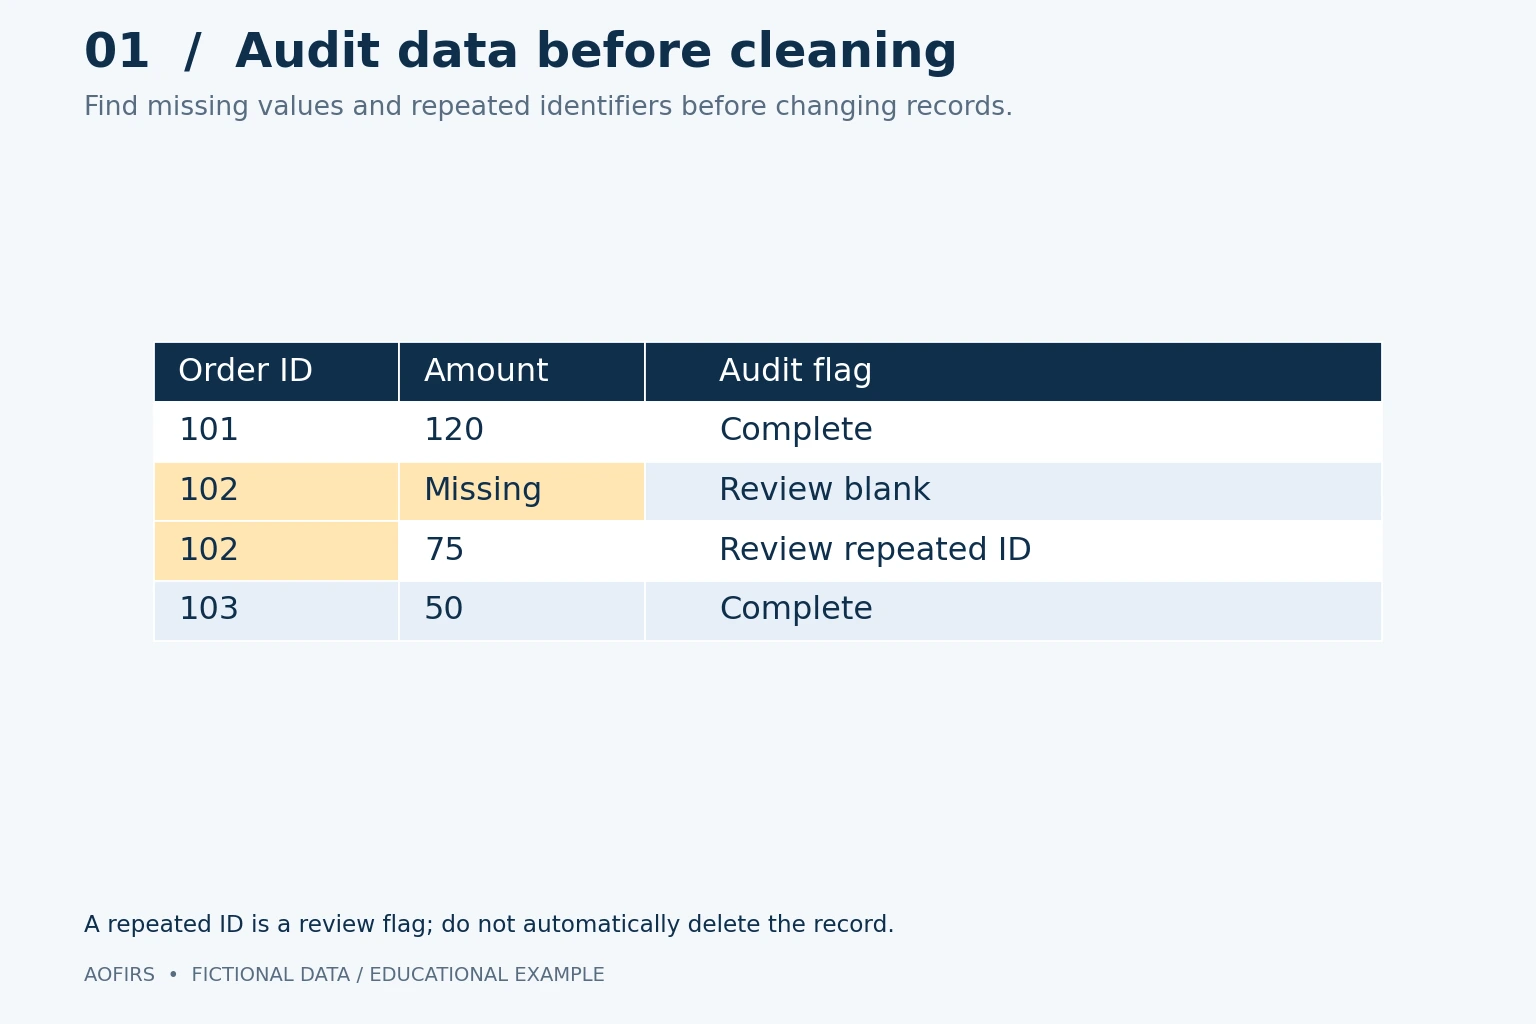
Audit [dataset] using [identifier] and the supplied data dictionary. Report row count, duplicate identifiers, missing values by column, invalid types, inconsistent categories, and unusual ranges. Return flagged record IDs and a proposed correction log with reasons. Do not change or delete records without approval. Provide reproducible code; state if you cannot execute it.
Check: Reconcile flagged records with the original. Repeated identifiers can be legitimate; missing values are not automatically errors.
2. Data transformation: scale numeric variables
Use when a method is sensitive to differences in measurement scale.
Copy-ready prompt
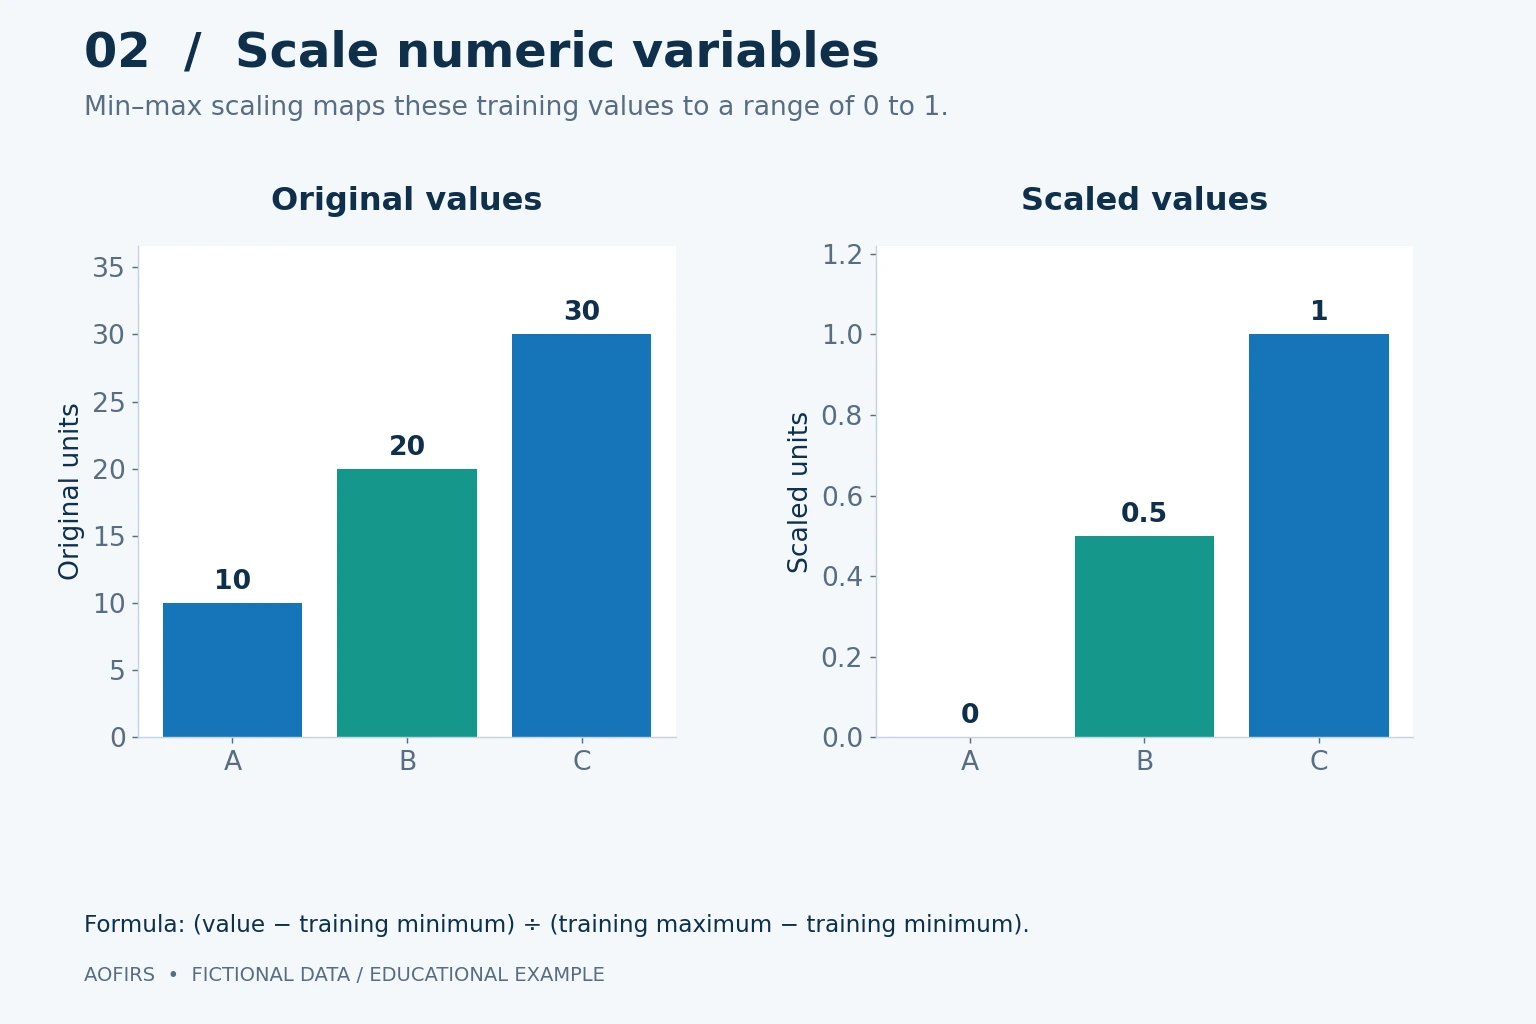
For [columns] in [dataset], assess whether min-max scaling or z-score standardization suits [method]. Explain the choice, preserve original columns, and report transformation parameters. For predictive modeling, learn preprocessing only within each training split or fold, then apply those fitted transformations to validation/test data. Supply reproducible code and before-and-after summaries.
Check: Scaling does not improve every model. Test values can fall outside the training min-max range.
3. Descriptive statistics: summarize the dataset
Use for an initial overview before modeling.
Copy-ready prompt
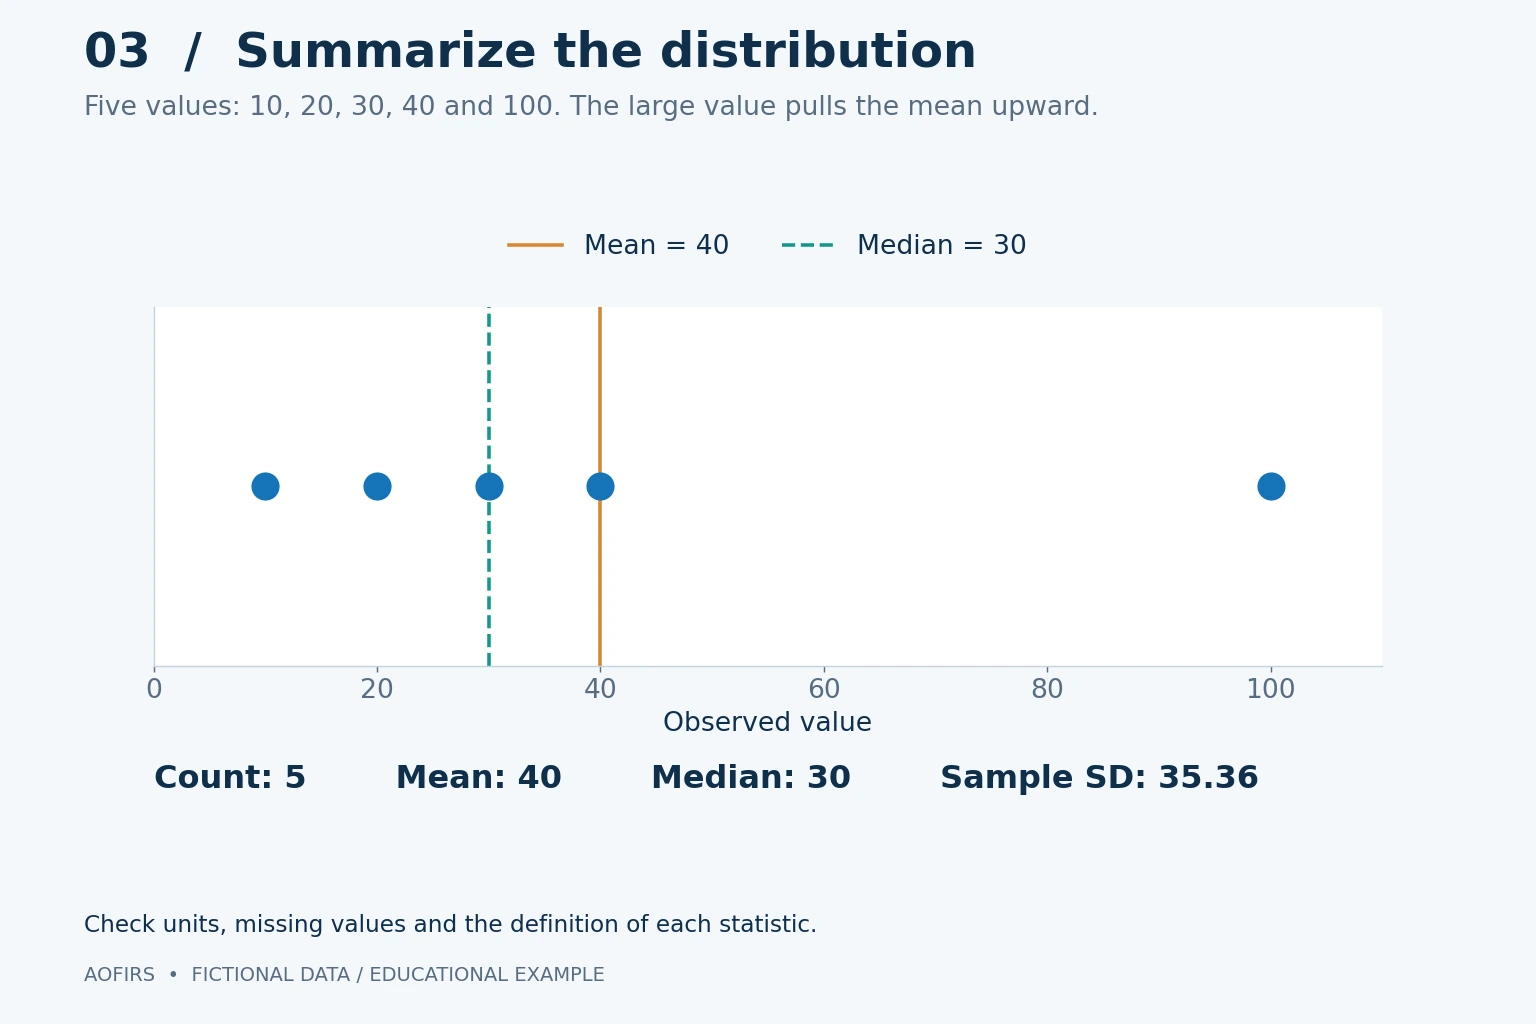
Summarise [dataset]. For numeric fields, report valid and missing counts, mean, median, standard deviation, minimum, maximum, and quartiles. Specify sample or population standard deviation. For categories, report counts, percentages, and denominators. Flag skewed distributions without labeling them errors. Include reproducible calculations and explain exclusions.
Check: Recalculate important values independently. Outliers can affect the mean more than the median.
4. Data visualization: choose meaningful charts
Use for presentations, dashboards, and research reports.
Copy-ready prompt
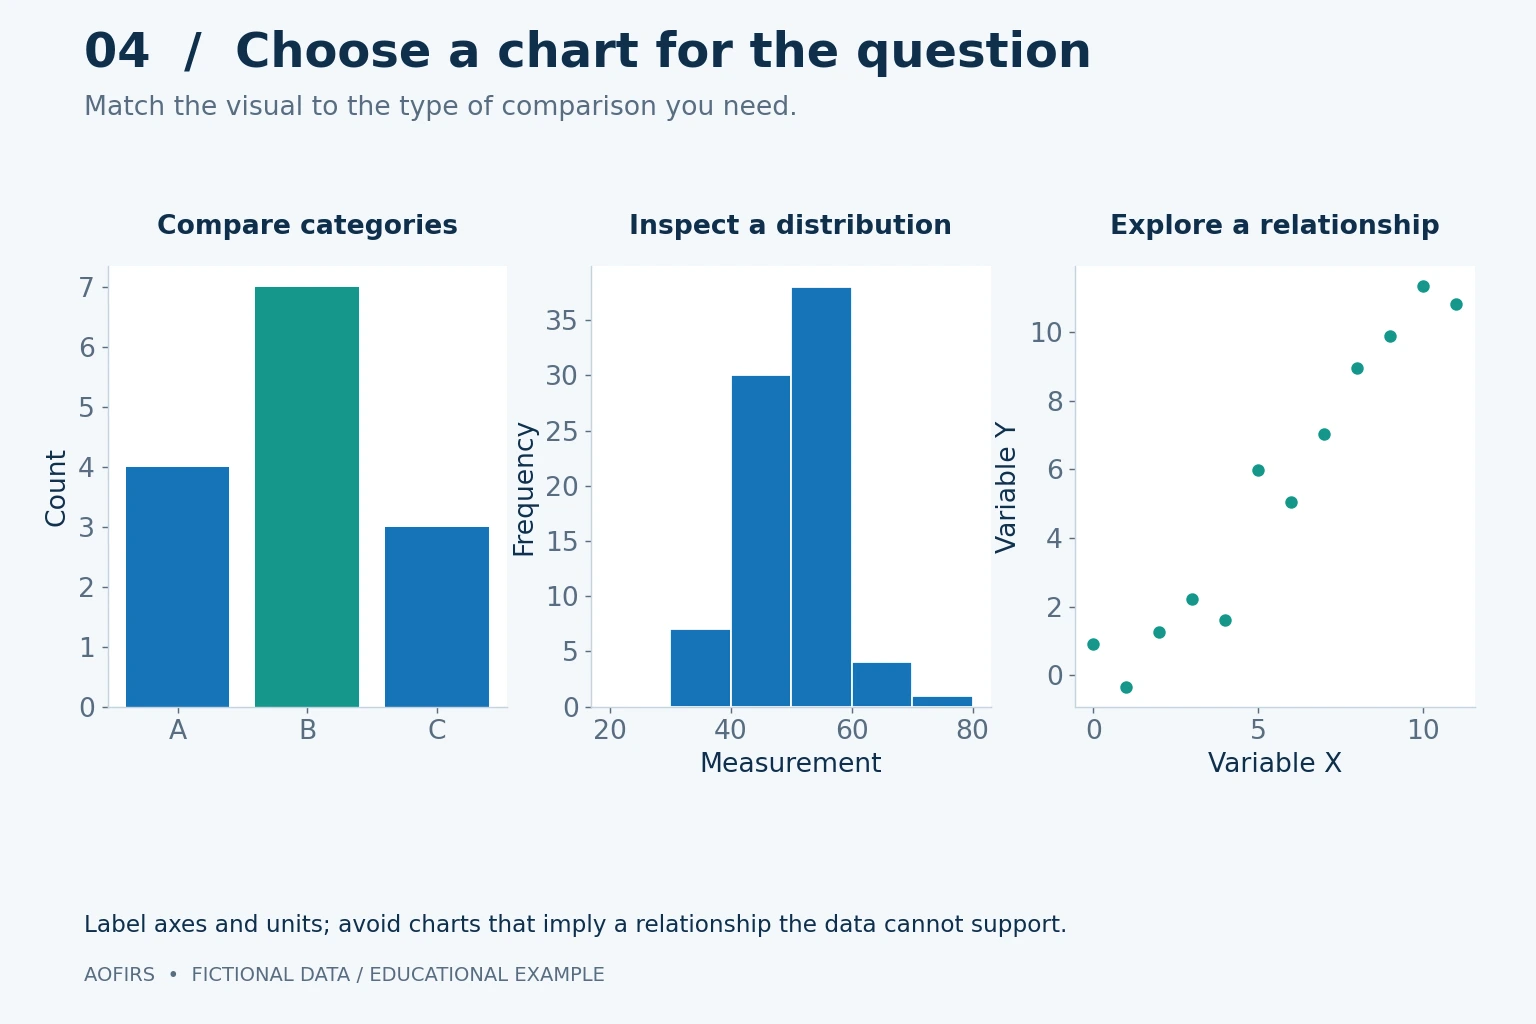
Visualize [question] using [dataset] and [columns]. Recommend a chart and justify it. Include descriptive titles, axes, units, legends, and sensible scales. Document missing-data treatment and aggregation. Create the chart if supported; otherwise, return reproducible plotting code. For bar charts, start the value axis at zero. Supply the plotted values for checking.
Check: Compare chart values with the underlying table. Use bars for categories, histograms for distributions, and scatter plots for relationships.
5. Trend analysis: examine changes over time
Use for observed changes, not automatic causal explanations.
Copy-ready prompt
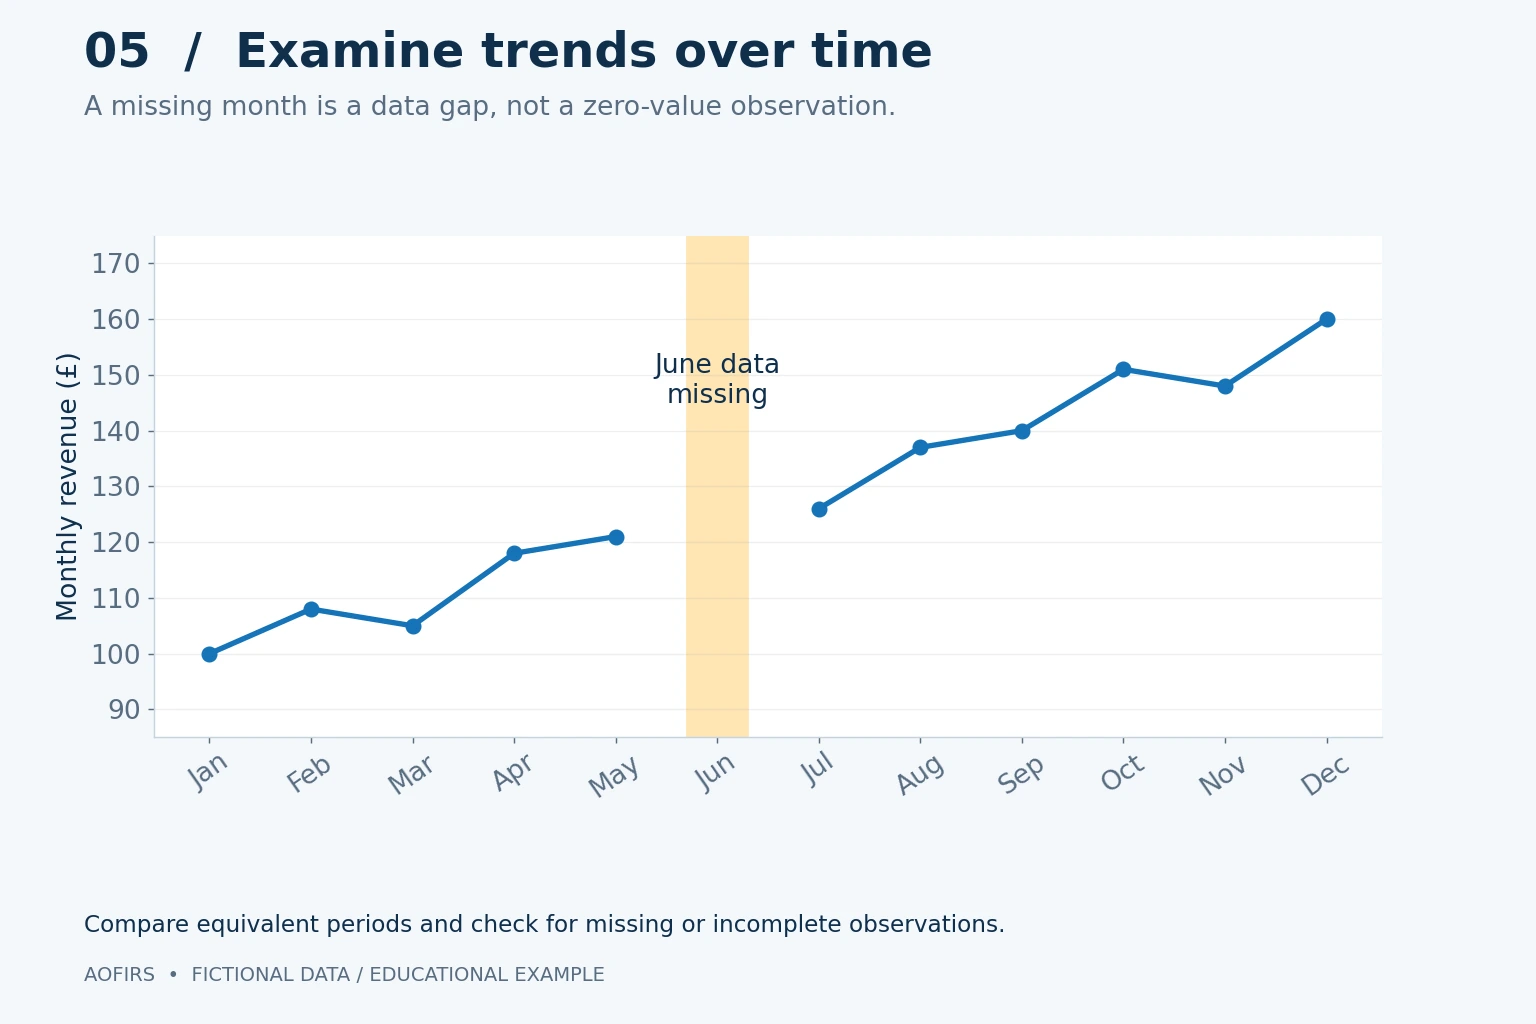
Analyze [metric] by [date] over [period]. Aggregate by [week/month/quarter], identify missing periods, and explain whether values should be summed or averaged. Calculate changes with explicit denominators and plot the series. Discuss possible trend and seasonal patterns cautiously. Separate observations from hypotheses; do not infer causes from the graph alone.
Check: Check date frequency, time zone, and coverage. A missing period is not necessarily a zero.
6. Regression: model relationships
Use when a justified statistical model can address the question.
Copy-ready prompt
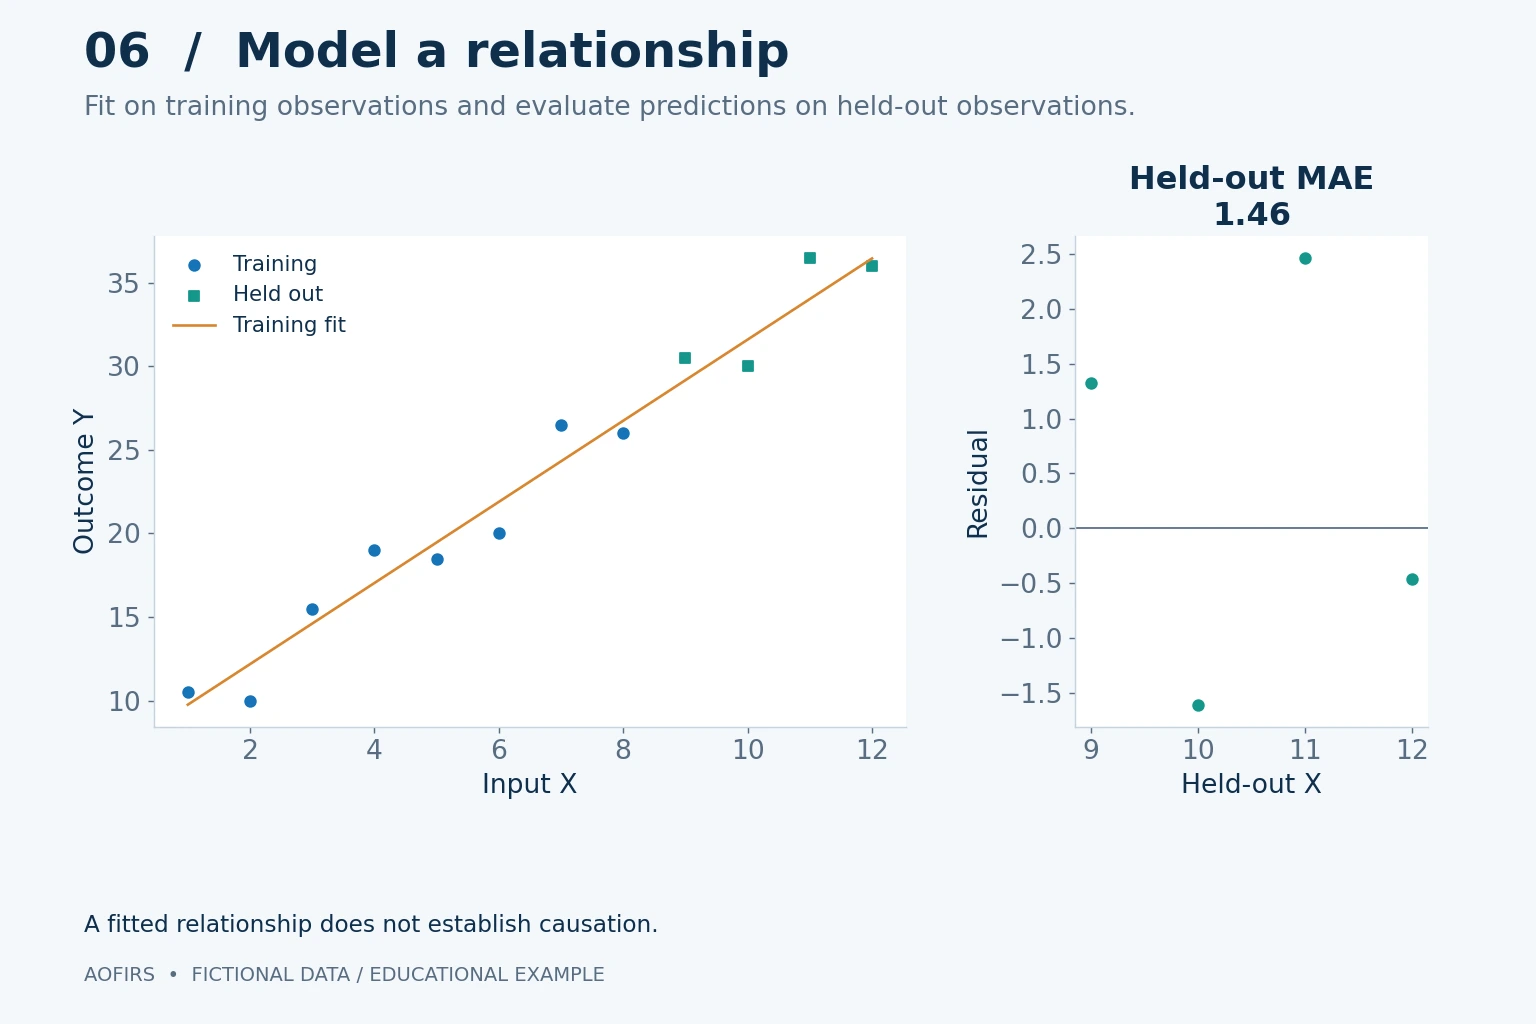
Assess regression for [target] using [predictors] in [dataset]. Explain assumptions and limitations. Choose validation suited to time order or grouped observations where relevant. Prevent leakage, fit using reproducible code, report coefficients and appropriate evaluation metrics, inspect residuals, and compare with a simple baseline. Distinguish prediction, association, and causal inference.
Check: Review assumptions and held-out performance. Coefficients alone do not establish cause and effect.
7. Categorical analysis: compare proportions
Use for survey responses, product categories, or sales channels.
Copy-ready prompt
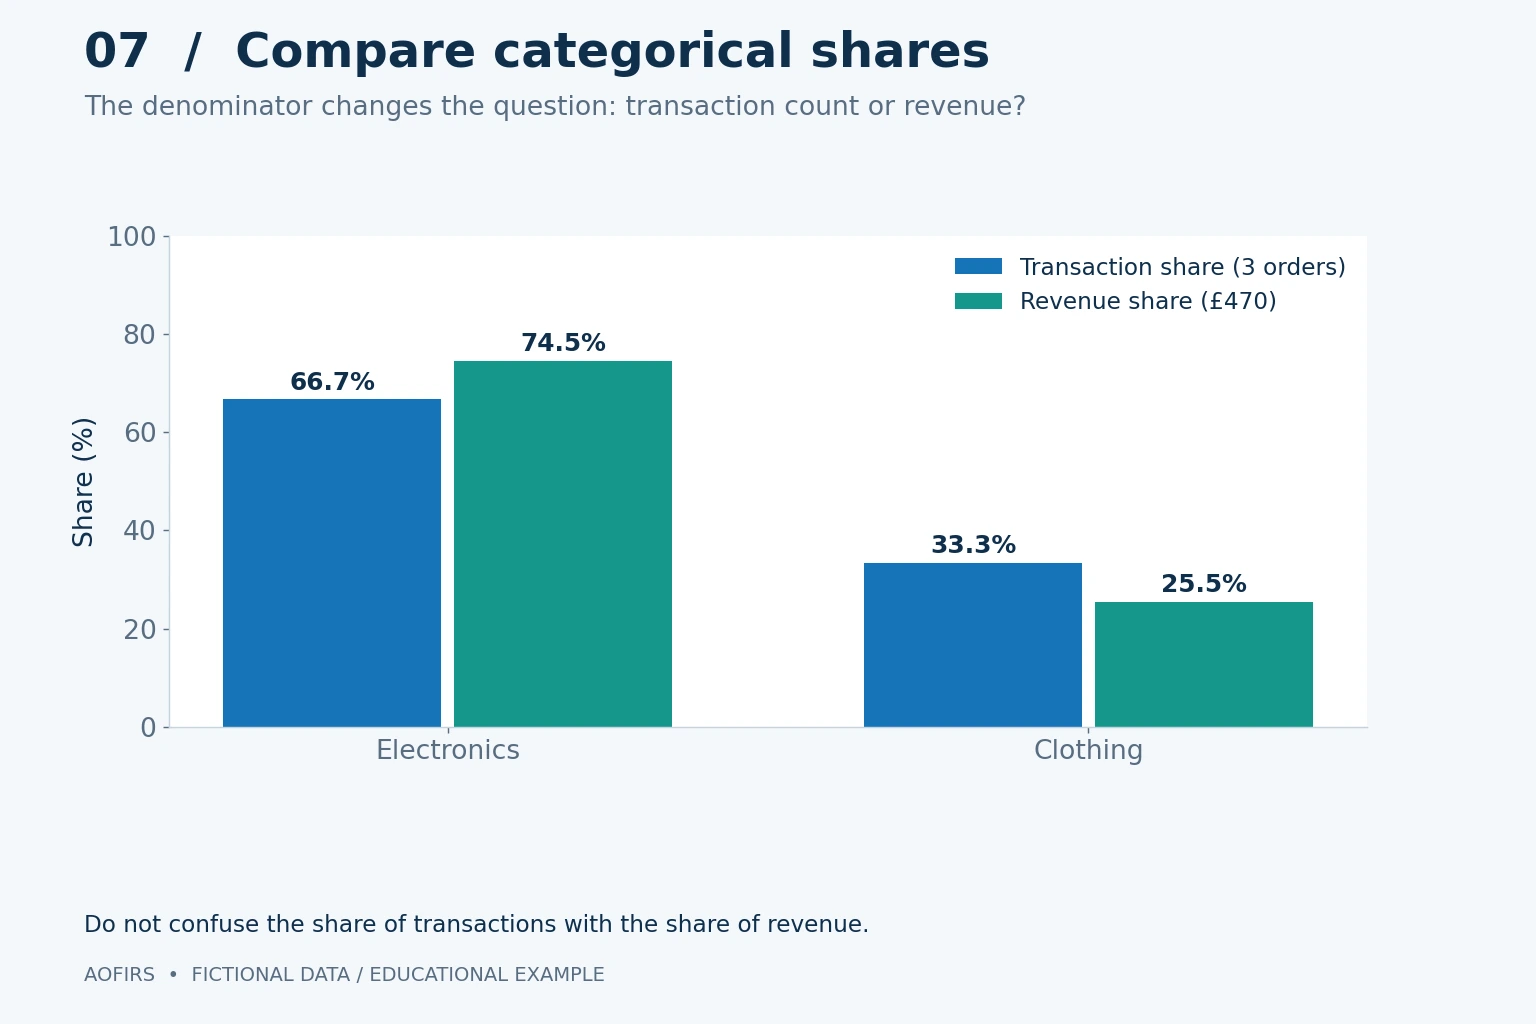
Group [dataset] by [category]. Report counts, percentages, and explicit denominators, keeping a missing/unknown group where appropriate. State whether shares describe customers, transactions, units or revenue. Create a sorted bar chart and reconcile categories to the source total. Flag overlapping or multi-select categories before expecting percentages to sum to 100%.
Check: Count shares and revenue shares to answer different questions. Rounding can also affect percentage totals.
8. Clustering: explore similar observations
Use for exploratory segmentation, not proof of natural categories.
Copy-ready prompt
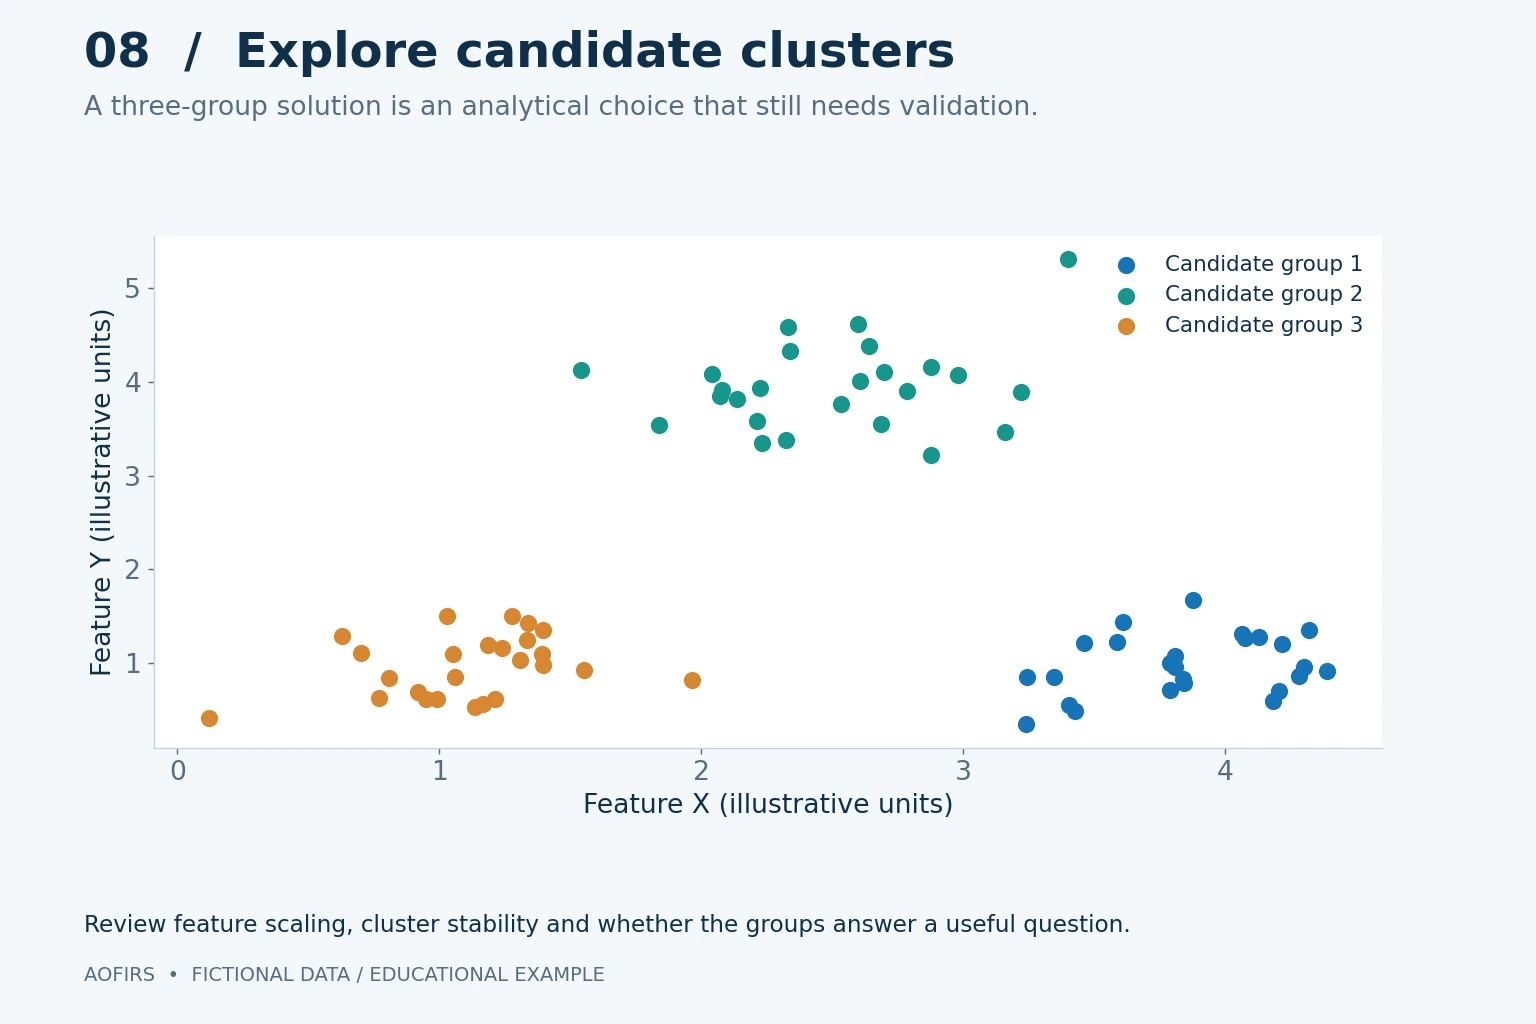
Explore clustering [dataset] using [features]. Review feature types, missingness, scaling, and outliers. Assess whether K-means is suitable. Compare justified cluster counts with appropriate diagnostics, including silhouette scores where meaningful. Report group sizes and profiles, supply reproducible code, and test sensitivity to features, scaling, and random seeds. Keep segment labels provisional.
Check: A high diagnostic score does not establish business usefulness. Evaluate stability and the purpose of each segment.
9. Correlation: assess variable associations
Use to explore the direction and strength of relationships.
Copy-ready prompt
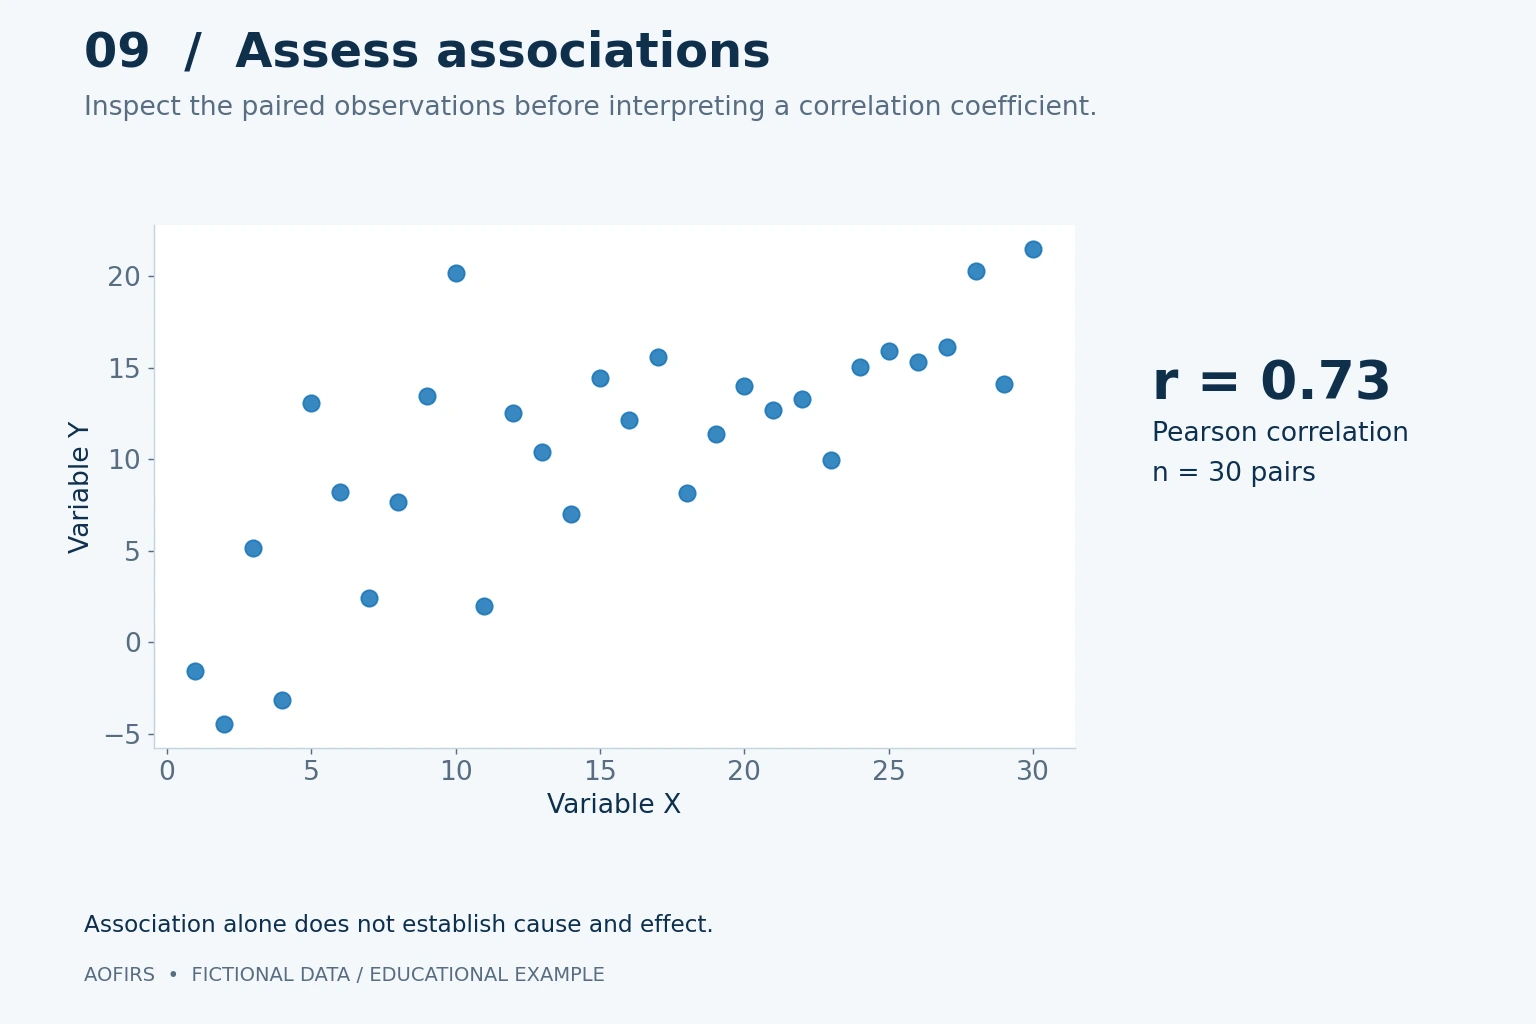
Examine [A] and [B] in [dataset]. Inspect measurement types, relationship shape, outliers, and missingness. Justify Pearson or Spearman correlation and explain assumptions for any inference. Report the coefficient, the analyzed sample size, and a labeled plot. Discuss uncertainty and possible confounding. Do not interpret association as causation.
Check: Pearson measures linear association; Spearman assesses rank-based monotonic association. Inspect the plot as well as the coefficient.
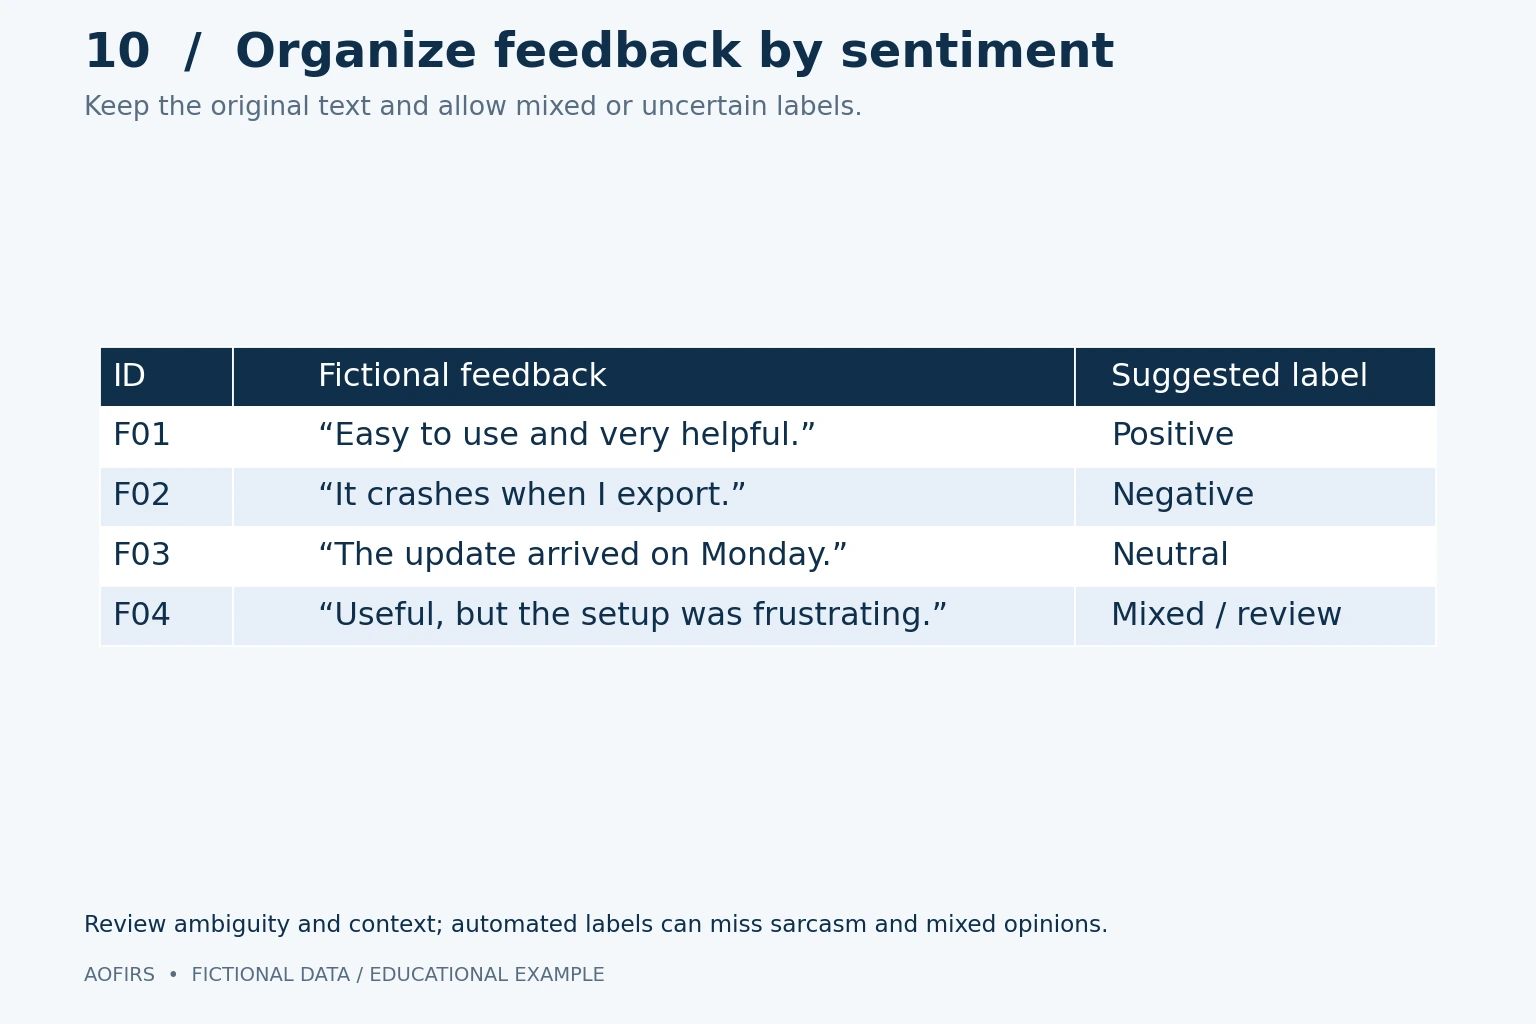
10. Sentiment analysis: organize feedback
Use for reviews, survey comments, and support records.
Copy-ready prompt
Classify approved, de-identified feedback from [dataset] as positive, negative, neutral, or mixed. Define decision rules, preserve record IDs, identify recurring themes and flag ambiguous cases. Report category counts and examples using only supplied text. Do not invent quotations. Propose a representative manual validation sample and document disagreements.
Check: Review sarcasm, mixed opinions, and specialist language. Sentiment labels are interpretations, not direct measurements of emotion.
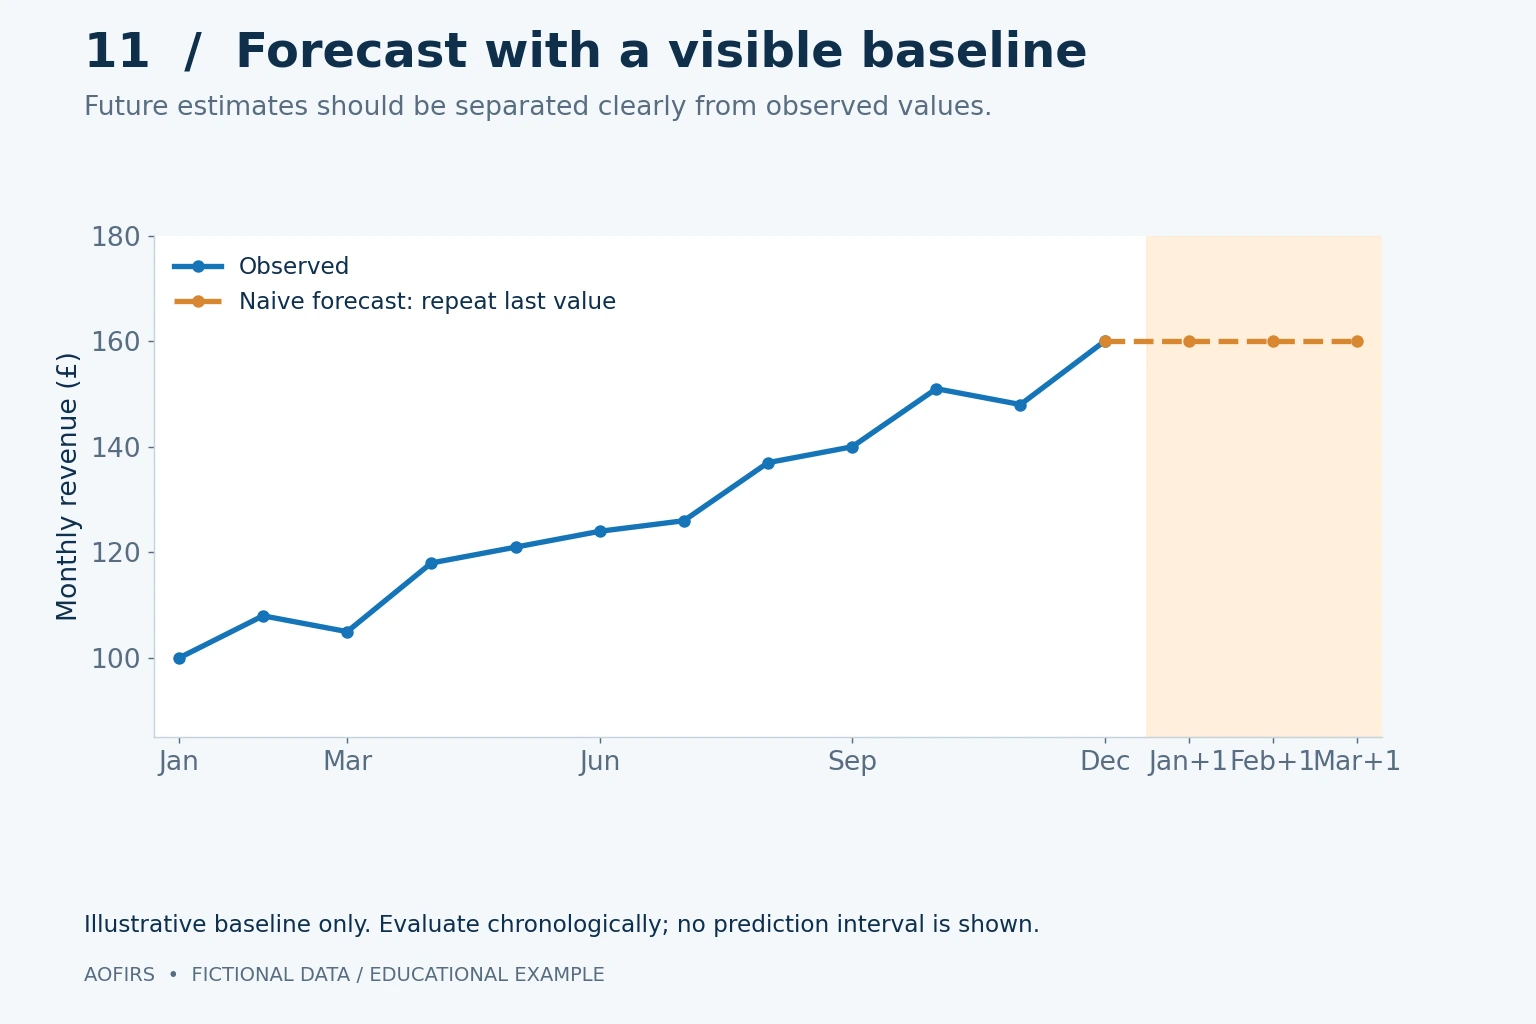
11. Time-series forecasting: estimate future values
Use only when historical coverage and the task support forecasting.
Copy-ready prompt
Forecast [metric] for [horizon] using [dated dataset]. Check frequency, missing periods, and historical coverage. If evidence is insufficient, explain why. Compare an appropriate model with naive or seasonal-naive forecasts. Use chronological or rolling validation and a justified error metric. Supply forecast intervals where supported, reproducible code, assumptions, and limitations.
Check: Keep future observations out of training. Forecasts are conditional estimates, not guaranteed outcomes.
12. Automated reporting: explain validated findings
Use after calculations and evidence tables have been checked.
Copy-ready prompt
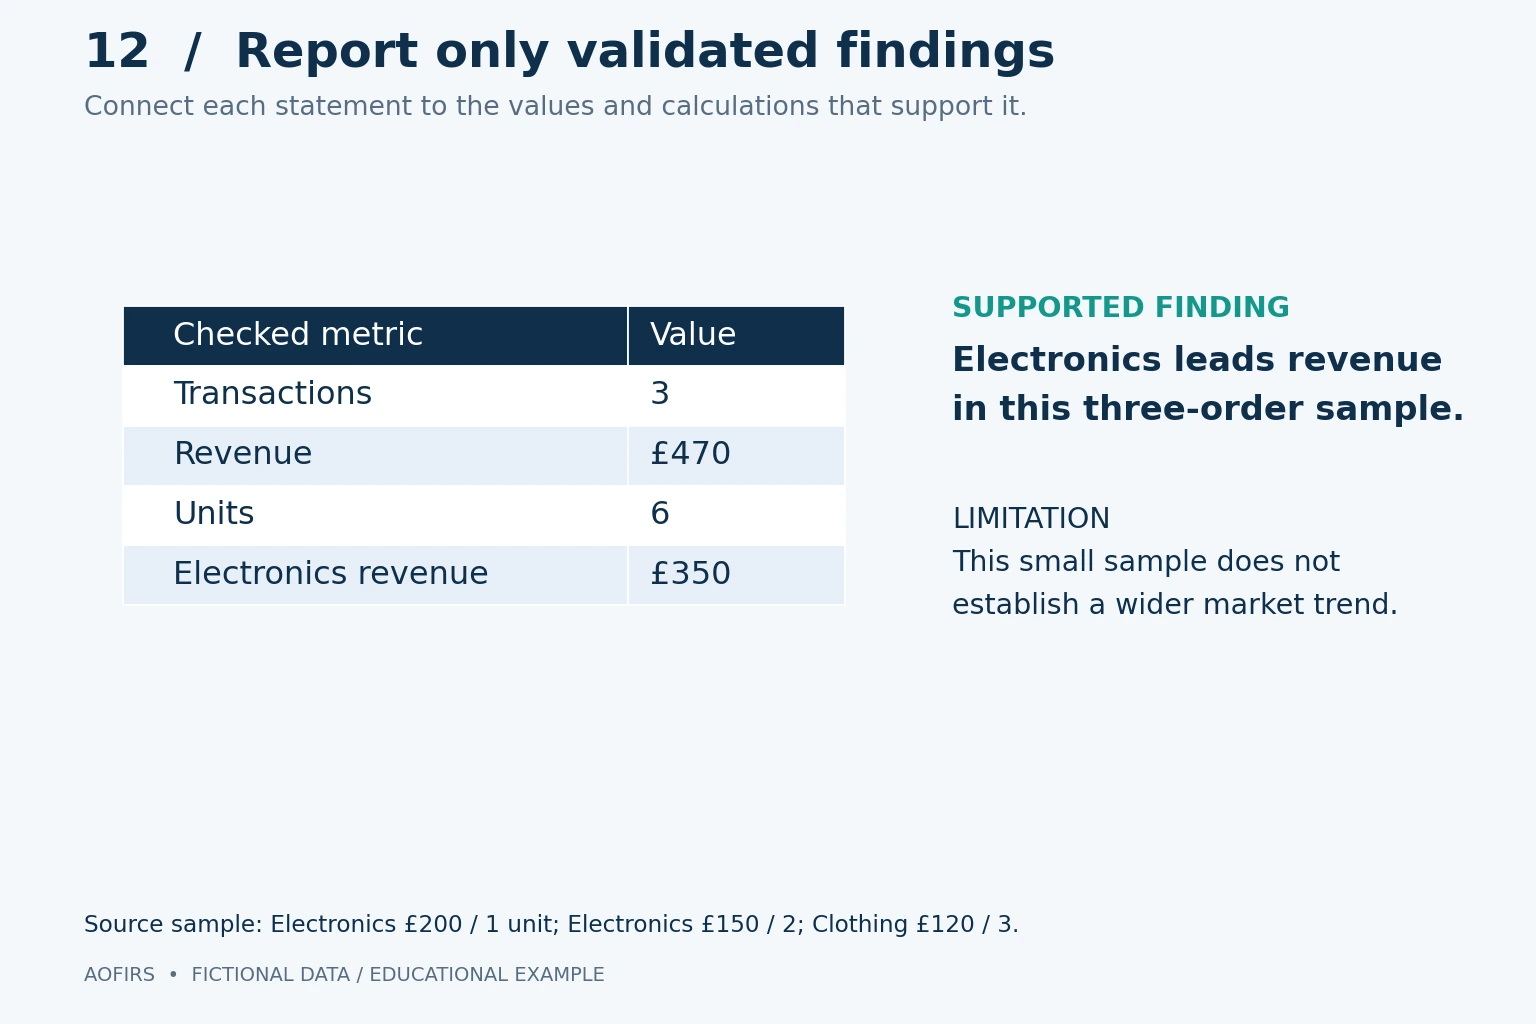
Using only the validated outputs for [project], prepare an executive summary, methods, key statistics, suggested figures, limitations, and recommendations. Reference the source table or calculation for each finding. Separate observed facts, possible explanations, and recommendations. Flag missing evidence and unsupported claims instead of inventing results.
Check: Trace every metric to its calculation. Recommendations must reflect the scope and strength of the evidence.
For implementation details, consult pandas guidance on missing data, scikit-learn’s preprocessing guide, and its data-leakage guidance. SciPy documents the distinct uses of Pearson and Spearman correlation.
Worked example: inspect, calculate, and report sales
The following three transactions are fictional. Revenue equals quantity multiplied by unit price; no discounts, returns, or taxes are included.
| Date (2026) | Category | Region | Quantity | Unit price | Revenue |
|---|---|---|---|---|---|
| 1 January | Electronics | North | 2 | £100 | £200 |
| 2 January | Clothing | South | 3 | £40 | £120 |
| 3 January | Electronics | North | 1 | £150 | £150 |
Apply template 1 to inspect the records, template 3 to summarize them, template 7 to compare revenue shares, and template 12 to report checked findings. The results are six units and £470 revenue: £350 from electronics and £120 from clothing. Electronics represents approximately 74.5% of sample revenue.
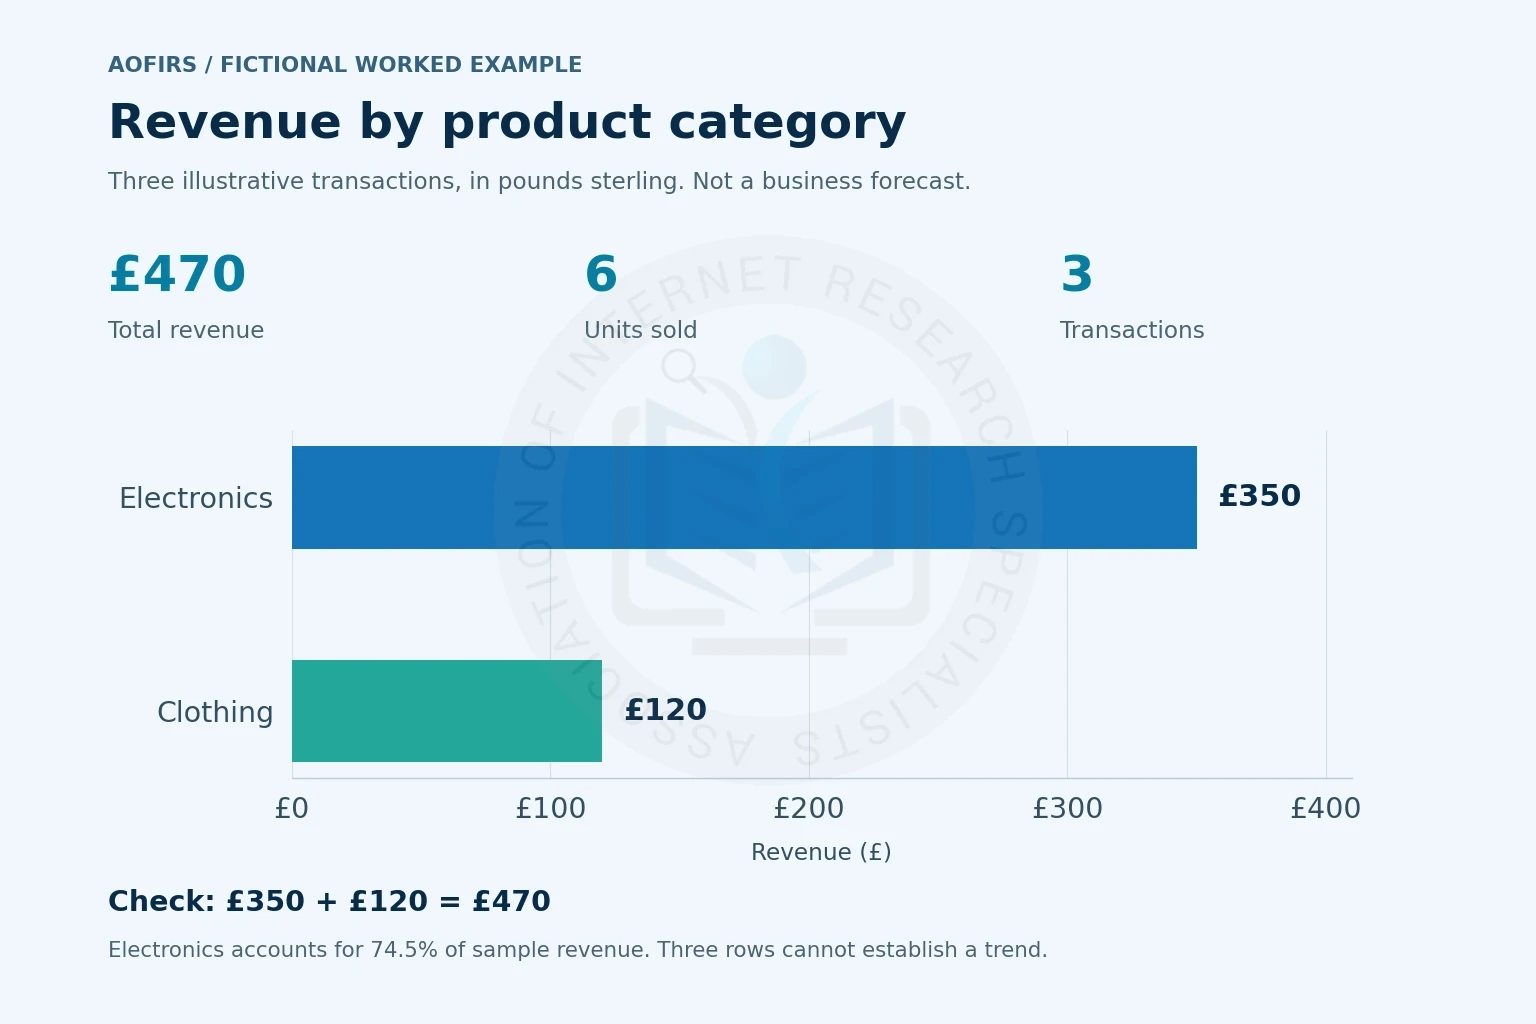
Report that electronics generated the most revenue in this sample. Three transactions cannot establish a sustained trend or support a reliable forecast. AOFIRS’s Researcher’s Journey from raw data to actionable insight discusses the progression from descriptive findings to more demanding analytical questions.
How to check AI data analysis
- Reconcile source and output row counts, exclusions, and totals.
- Independently recalculate important figures and inspect the code or formulas.
- Check assumptions, denominators, units, and missing-value treatment.
- Inspect chart scales, labels, and underlying plotted values.
- Check model validation, baselines, leakage, and uncertainty.
- Separate observations from hypotheses and document human corrections.
For forecasting validation, scikit-learn explains why time-ordered splits avoid evaluating past observations using future training data. Its silhouette-analysis example illustrates one clustering diagnostic, rather than a universal proof of valid segments.
For research applications, AOFIRS’s report on AI tools in market research emphasizes critical review. The learning publication on integrating generative AI into a research workflow offers related context for keeping source evidence and generated interpretation distinct.
Choose tools by capability, not just their names
| Environment | Useful capability | What to check |
|---|---|---|
| AI chat with file and execution tools | Data inspection, code, and charts were enabled | Actual file access, executed code, and exportable results |
| Copilot in Excel | Workbook questions, formulae, and chart assistance | Available modes, subscription, and workbook changes |
| Gemini in Google Sheets | Formulas, analysis, and charts | Eligible plan, analysis steps, and chart source data |
| Python or R | Scripted, repeatable statistical workflows | Code, dependencies, assumptions, and validation |
Capabilities vary by account and environment. Test a small known dataset before relying on a workflow. Save prompts, code, data versions and outputs so another analyst can inspect the work.
Frequently asked questions
What makes a data analysis prompt effective?
Specify the dataset, question, relevant fields, method, output, and checks. Make uncertainty and missing information visible.
Can AI clean data automatically?
Some tools can execute changes. Request an audit and proposed corrections first, then review and approve them.
Can AI perform regression and forecasting?
An execution-enabled tool can fit models, or a text assistant can generate code. Appropriate design and validation remain essential.
Do I need Python or SQL?
Not always. Spreadsheet tools support many tasks. Code is valuable for complex processing, repeatable workflows, and independent checking.
Are generated charts always accurate?
No. Check the plotted values, aggregation, missing records, labels, and scales against the underlying data.
Can I upload confidential research records?
Use only approved arrangements that meet applicable obligations and policies. Minimize sensitive information and review access and retention controls.
Conclusion
A useful prompt defines a task that can be checked. Preserve the data, choose a suitable method, inspect executed calculations, and report limitations. Reliable conclusions come from the whole analytical process, not from prompt wording alone.