
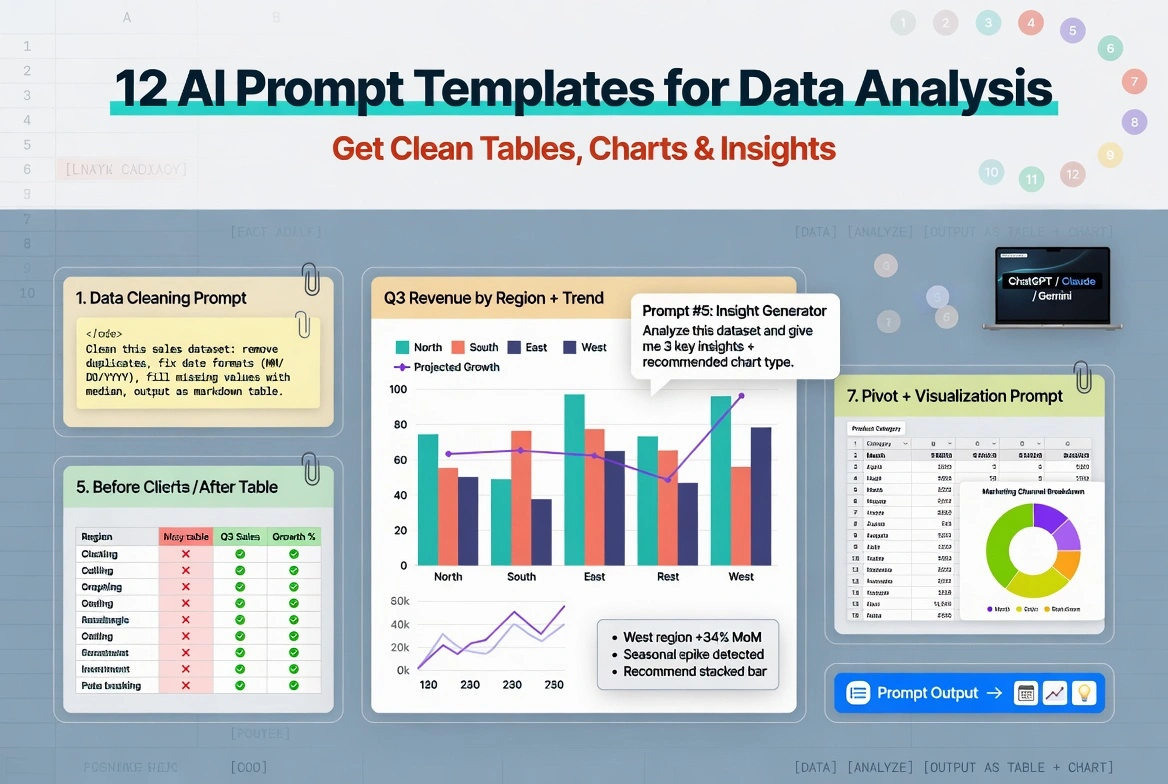
In today’s data-driven world, effective data analysis is essential for making informed decisions. As businesses and organizations generate vast amounts of data, AI tools have become invaluable in streamlining data analysis tasks, from cleaning to generating meaningful insights. One of the most powerful aspects of AI in this field is the use of prompt templates. These AI-driven templates help analysts automate tedious processes, reduce human error, and quickly extract valuable insights from complex datasets. This article explores 12 AI prompt templates that can help you clean data, create insightful visualizations, and generate actionable insights that drive decision-making.
Why AI Matters in Data Analysis
The sheer volume of data available today makes it difficult to process and analyze manually. AI tools, especially those using machine learning (ML) and natural language processing (NLP), can process data faster and more accurately than traditional methods. By incorporating AI-powered prompt templates into your workflow, you can automate many of the routine tasks involved in data analysis. This not only saves time but also ensures consistency and precision across your analyses.
1.Data Cleaning: Remove Duplicates and Handle Missing Values
Data cleaning is one of the most crucial steps in the analysis process. Raw datasets often contain duplicates, missing values, or errors, which can distort the analysis. AI prompt templates can quickly identify and clean these issues, ensuring that the data is ready for deeper analysis.
Prompt Template:
Detect and remove duplicate records from the dataset. For missing values, recommend the best method for handling them (e.g., imputation or removal).
Real-World Example:
For instance, in a customer database, duplicate entries for the same person might skew the results. Using an AI prompt to clean up the duplicates helps ensure that the data accurately reflects each customer’s unique information
2.Data Transformation: Scaling and Normalizing Data
When analyzing multiple variables, it’s important to standardize their scales so that no single variable disproportionately influences the results. AI can assist with tasks like scaling or normalizing data, making it easier to work with in machine learning models.
Prompt Template:
“Normalize the dataset by scaling numeric values to a range of 0 to 1 for all features.”
Real-World Example:
A sales forecasting model, for example, could benefit from normalized data, where variables like price, discount, and quantity are on the same scale. This ensures the model isn’t biased by one variable’s scale.
3.Summarizing Data with Descriptive Statistics
Descriptive statistics offer a quick summary of the data, providing insights into its central tendency, spread, and overall distribution. AI can automate the generation of these statistics, saving analysts time while ensuring they don’t miss key insights.
Prompt Template:
“Generate descriptive statistics for the dataset, including mean, median, mode, and standard deviation.”
Real-World Example:
An analyst could use this to quickly understand the average customer purchase, the most common product types, and how much variability exists in sales data, providing a solid foundation for further analysis.
4.Data Visualization: Creating Bar Charts and Histograms
Visualizing data is a great way to identify trends, outliers, and relationships between variables. AI tools can generate various types of visualizations, such as bar charts, histograms, and line graphs, that provide valuable insights at a glance.
Prompt Template:
“Create a bar chart that shows the distribution of sales by region.”
Real-World Example:
A sales manager might use this to visually compare the performance of different regions, making it easier to identify where to focus marketing efforts or resources.
5.Identifying Trends with Line Graphs
Line graphs are ideal for tracking changes over time. AI can automatically generate these graphs based on historical data, making it easier to spot trends and make future predictions.
Prompt Template:
“Generate a line graph showing the trend of monthly sales for the past year.”
Real-World Example
Real-World Example:
A business could use this to track how their sales fluctuate over the months, helping them prepare for seasonal changes and align their sales strategies accordingly.
6. Predictive Modeling: Forecasting with Regression Analysis
Predictive modeling helps businesses forecast future trends based on past data. Regression analysis, a common technique for making predictions, can be automated with AI.
Prompt Template:
“Perform a linear regression to predict sales for the next quarter based on past data.”
Real-World Example:
A retail company could use regression analysis to forecast sales, helping them plan inventory levels and staffing needs.
7.Categorical Data: Creating Pie Charts
For datasets with categorical data, pie charts are a simple way to show the proportions of each category. AI can generate pie charts quickly, giving users a visual representation of how different categories compare.
Prompt Template:
“Create a pie chart showing the distribution of product categories in sales.”
Real-World Example:
A product manager might use this to understand which product categories are performing best, guiding future inventory decisions.
8.Clustering Data: Grouping Similar Items
AI can also help group similar data points using clustering algorithms, such as K-means. This technique is useful for segmenting data into meaningful categories.
Prompt Template:
“Use K-means clustering to group customers based on purchasing behavior.”
Real-World Example:
By clustering customers based on their purchasing habits, a business can create more targeted marketing campaigns tailored to each segment.
9.Correlation Analysis: Identifying Relationships Between Variables
Correlation analysis identifies how closely two variables are related. AI tools can calculate correlation coefficients and generate scatter plots to visualize these relationships.
Prompt Template:
“Calculate the correlation between price and customer satisfaction and create a scatter plot.”
Real-World Example:
A company might use this analysis to determine if there’s a relationship between the price of their products and how satisfied customers are with their purchases.
10.Sentiment Analysis: Analyzing Customer Feedback
Sentiment analysis helps businesses understand customer opinions by categorizing feedback as positive, negative, or neutral. AI can perform this analysis on reviews, surveys, or social media posts.
Prompt Template:
“Analyze customer feedback and categorize it as positive, negative, or neutral.”
Real-World Example:
A business could use sentiment analysis to assess how customers feel about a new product launch, allowing them to quickly address any negative sentiment.
11.Time Series Forecasting: Predicting Future Values
Time series forecasting helps predict future values based on historical data. AI models can automate this process, making it easier to forecast future trends in areas like sales, website traffic, or stock prices.
Prompt Template:
“Perform a time series forecast to predict the next six months of sales data.”
Real-World Example:
A retail business might use time series forecasting to predict future sales, helping them manage inventory and staffing accordingly.
12.Automated Reporting: Generating Insights in Minutes
AI can also automate the process of generating detailed reports based on data analysis. These reports can include key findings, visualizations, and actionable insights, saving analysts hours of manual work.
Prompt Template:
“Generate a summary report with key insights, visualizations, and recommendations based on the data analysis.”
Real-World Example:
A business executive could use automated reports to quickly assess the performance of a product line, enabling faster decision-making and strategy adjustment.
Conclusion:
AI-powered prompt templates have revolutionized the way data analysis is performed. From data cleaning and transformation to predictive modeling and automated reporting, these tools help analysts work more efficiently and generate deeper insights faster. By leveraging AI, businesses can make more informed decisions, optimize their operations, and stay competitive in an increasingly data-driven world.